United States census of 2000 was an extensive nationwide information-gathering project conducted by the U.S. federal government. The Census Bureau, an agency of the U.S. Department of Commerce, conducts a census of population and housing every 10 years. Census taking, also called enumeration, enables the government to obtain a current description of the society it governs. This description includes the size of the population, as well as such facts as age, employment, ethnicity, housing, income, race, and sex. Because of its 10-year cycle, the U.S. census is called a decennial census. The 2000 census was the 22nd U.S. decennial census. The first one was in 1790.
Census information helps government agencies administer programs, distribute revenues, study social and economic problems, and plan activities. Statistics provided by the census affect the distribution of funds for economic development programs, housing, school aid, welfare, and Social Security. In addition, population size determines the number of representatives each state will have in the U.S. House of Representatives. Population totals are also used to draw boundaries for electoral districts.
Planning, conducting, and processing a census is a difficult and expensive project. The census of 2000 employed about a million people, and cost about $8 billion. This article reviews the 2000 census, highlights some of the results, examines some of the issues surrounding census procedures, and discusses possibilities for future counts.
Conducting the 2000 census
Early planning for the 2000 census began while the 1990 census was still underway. During the 1990 census, the Census Bureau compiled ideas for how to improve the process, and it evaluated the cost and effectiveness of all potential changes.
Assembling a work force.
In preparation for the census, the bureau established 12 regional census centers and 520 local census offices. Many permanent census employees were assigned to key positions in these field offices. A major task for the field offices was the recruitment and training of hundreds of thousands of temporary employees.
The Census Bureau conducted “dress rehearsal” censuses in 1998 in three parts of the country. The bureau used these rehearsals to test procedures and to determine what problems needed to be addressed. After final adjustments to the plans, census activities accelerated rapidly in late 1999 and early 2000. The project reached its peak employment in mid-2000.
Developing questionnaires.
For all censuses from 1960 to 2010, the Census Bureau mailed out census questionnaires and asked the public to complete them and mail them back. In 2000, the Census Bureau created two kinds of questionnaires—a short-form questionnaire and a long-form questionnaire. The short-form questionnaire had a small number of basic questions, which were asked of all people and housing units. The long-form questionnaire included additional questions, which were asked only of a sample that consisted of about one-sixth of all households.
The careful selection of questions was a major project for the Census Bureau. The bureau first selected the topics to be included. Agencies at all levels of government influenced the choice of topics. Other users of census data, including business executives, educators, and researchers, worked with the Census Bureau through advisory committees. These committees met regularly with bureau specialists to discuss census needs and uses. The bureau also held public meetings in various regions of the country.
After selecting the topics to be covered, the Census Bureau developed questions to obtain the desired information. Writers carefully worded questions to avoid anything that might bias (slant) responses. The bureau conducted many studies to test whether new questions produced useful responses.
During the planning for the census, some members of Congress argued that the Constitution of the United States calls only for a head count, and that lengthy census questionnaires were an invasion of privacy for American citizens. In response to these concerns, the Census Bureau determined that the final questionnaires would include only items that were required specifically by a law or that were essential to the implementation of a law. For example, the implementation of voting rights laws requires information on race and Hispanic ethnicity for determining voting precincts.
Items on the short-form questionnaire included the names of people in the household and the household’s telephone number. This information was used only for checking responses and not for release to the public. Other short-form items provided the basic information needed for every geographic area. This information included age, race, Hispanic ethnicity, and the type of housing unit.
The long-form questionnaire included such items as 1999 income, language spoken at home, veteran status, and the household’s number of rooms and bedrooms. The long form is sometimes referred to as the sample form, and the additional questions as the sample questions. Giving select questions to only a sample of the population allowed the bureau to obtain additional information without placing a burden on every household.
Distributing forms.
A key resource for conducting a census is the master address file, a listing of more than 100 million addresses. An accurate address list makes it possible to reach a high percentage of households with the first mailing of questionnaires. This increases accuracy and reduces the cost of having individual enumerators (census takers) find residences and administer questionnaires in person.
Throughout the 1990’s, the Census Bureau and the U.S. Postal Service worked cooperatively to prepare an address file suitable for census purposes. Because both the Census Bureau and the Postal Service operate under strict rules to preserve the confidentiality of information about individual citizens, the U.S. Congress passed special legislation in 1994 to permit this cooperation. The preparation of detailed maps continued through the decade. New mapping technology enabled Census Bureau geographers to create a system of digital maps and software that provided easy access to on-screen and printed maps.
The Census Bureau mailed out advance letters in mid-March and questionnaires in late March. Recipients were asked to make all answers accurate as of Census Day, April 1, 2000. The bureau established special phone numbers so the public could request new forms, ask for questionnaires in other languages, receive help with questions, complete the questionnaire by phone, and voice concerns.
The Census Bureau made special arrangements to reach people who did not live in such regular housing units as individual houses and apartments. The census identifies these people as living in group quarters. There are two main categories of the group quarters population—institutionalized and noninstitutionalized. The institutionalized population includes people in long-term supervised care or in places such as nursing homes and prisons. The noninstitutionalized population lives in quarters such as college dormitories, military barracks, and group homes. The Census Bureau developed a list of all group quarters and made special arrangements to count their residents.
Another special program was designed for the counting of homeless people. The bureau arranged for enumeration at shelters and at sites where homeless people were known to spend the night.
Promoting response.
An extensive publicity campaign made the census a highly visible national event and encouraged response. The Census Bureau established partnerships with governments, schools, community organizations, and other institutions to distribute census information. In addition, the bureau, with congressional approval, used paid advertising to further encourage response. The bureau spent more than $100 million on television, radio, and print advertisements.
The Census Bureau also developed a number of ways to encourage response by telephone, over the Internet, and at shopping malls and other public locations. One problem with these methods was that some households responded more than once. During processing of the 2000 census returns, the bureau found that nearly 10 percent of households had provided two or more forms. Computer operations removed most duplicated responses.
Collecting forms.
Most households that received census questionnaires mailed them back within a few weeks. The questionnaire return rate for the 2000 census was about 67 percent, an improvement over the 1990 rate of 65 percent. Although the response rate was higher than expected, it still left about one-third of the questionnaires unreturned.
The bureau’s nonresponse follow-up program worked to obtain the missing information. Beginning in late April, enumerators went to the addresses for which no questionnaire had been returned. If an adult member of a household could be located, the enumerator asked him or her to answer the questions for each member of the household. In some cases, enumerators returned to an address as many as six times in an effort to find someone at home. In about 3 percent of the nonresponse follow-up cases, the enumerator finally settled for obtaining the information from neighbors or building managers.
The Census Bureau completed nonresponse follow-ups for every geographic area, as well as additional follow-ups for about 10 percent of households. Households that reported more than six members were visited by enumerators to obtain additional information that would not fit on the original forms. Many housing units initially identified as vacant were revisited in a final effort to determine whether anyone lived there. All stages of follow-up were completed by early September.
Processing information.
The census of 2000 incorporated computer technology more fully than any previous U.S. census. The Census Bureau used a system of computerized sorters, scanners, and processors—collectively called the Data Capture System 2000 (DCS 2000)—to efficiently collect and handle incoming data.
The Census Bureau carefully reviewed the incoming information for quality. Incomplete and contradictory responses were corrected or referred to the appropriate local census office for follow-up. Addresses were checked to ensure complete coverage and to identify and remove duplicate questionnaires. Computers called optical character readers interpreted handwritten answers on census forms. If a piece of information for a person was missing, such as age or race, special programs provided an estimate.
Releasing information.
The Census Bureau began releasing data findings to the public in late 2000. The first numbers published were total population counts and some counts of racial and ethnic groups. In December, the Census Bureau announced the official counts for each state. Official counts for counties, cities, townships, and all other political jurisdictions appeared in March 2001. The bureau also released data for millions of geographic areas, such as city blocks and their equivalents in rural areas. The Census Bureau released further information as processing was completed.
The Census Bureau posted general information from the census of 2000 on the Internet at www.census.gov. The bureau also released the data in electronic formats such as compact disc. Some of the most widely used information appeared in traditional paper bulletins and books.
An overview of census results
The official count of the population of the United States on April 1, 2000, was 281,421,906. This marked an increase of 13.2 percent over the 1990 census count of 248,709,873. The population growth of 32.7 million people was the largest census-to-census increase in U.S. history.
Population distribution.
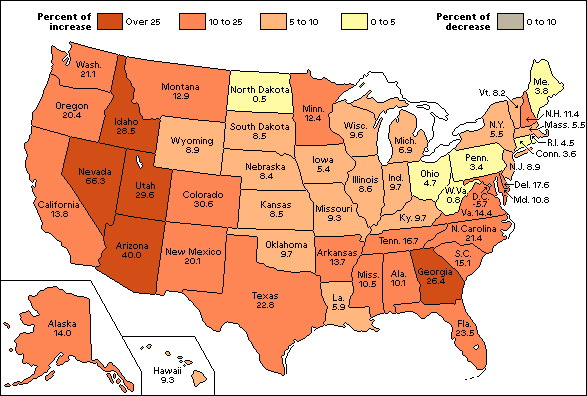
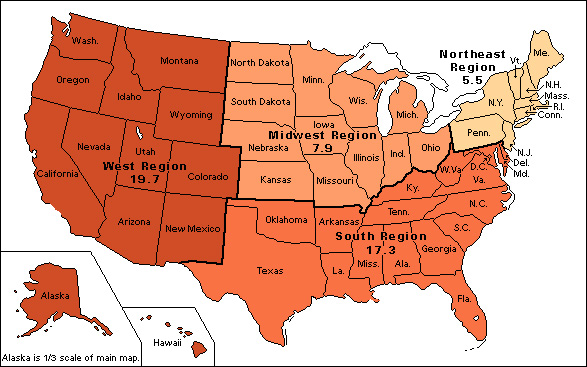
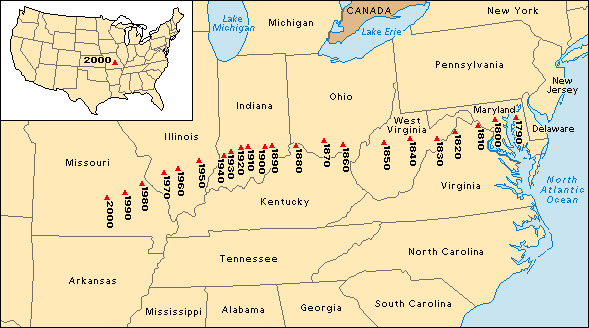
Every state and most counties gained population during the 1990’s. However, some regions showed more significant growth than others. The West as a whole grew 19.7 percent, the South 17.3 percent, the Midwest 7.9 percent, and the Northeast 5.5 percent. In total numbers, the South remained the most populated region, with 100.2 million. It was followed by the Midwest with 64.4 million, the West with 63.2 million, and the Northeast with 53.6 million.
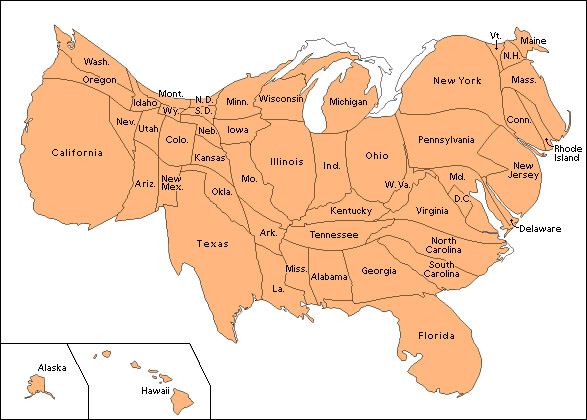
The fastest rates of growth occurred in the states of Nevada (66.3 percent), Arizona (40.0 percent), and Colorado (30.6 percent). The largest numerical increases were in California (4.1 million), Texas (3.9 million), and Florida (3.0 million). Rapid population growth was most common in metropolitan counties. In 2000, 226 million people (80.3 percent) lived in metropolitan areas. A metropolitan area consists of a central city and the developed area that surrounds it.
Many large cities had population increases during the 1990’s, mainly because large numbers of recent immigrants settled there. For example, New York City, the nation’s largest city, gained about 686,000 people, for a total of 8,008,278. Phoenix was the fastest-growing of the 10 largest cities. Its population grew by 34 percent, from 983,403 people in 1990 to 1,321,045 people in 2000. Most large central cities continued to experience losses in white population. Growing suburban areas, however, gained large numbers of Hispanic, Asian, and African American residents in addition to the traditional white population.
Age, sex, families, and housing.
In 2000, the median age of the U.S. population was 35.3 years. This means that half the people were younger than 35.3, and half were older. This was the oldest median age ever, and a jump of 2.4 years since 1990. This increase in age was partially the result of improvements in health and medicine that enabled more people to live longer lives. The increase also reflected a decline in the number of children per family. The aging of the baby boom generation—the large group of people born in the United States from 1946 to 1964—was another factor that contributed to the increase in the median age. In 2000, baby boomers aged 45 to 54 represented the fastest-growing age group.
Of the total population, there were 138.1 million males (49.1 percent) and 143.4 million females (50.9 percent). In the age group under 18, boys outnumbered girls 37.1 million to 35.2 million. At ages 65 and over, women outnumbered men 20.6 million to 14.4 million.
In 2000, there were 105.5 million households, 68.1 percent of which were families. For census purposes, a family is defined as a set of two or more people who are related by birth or marriage and who live in the same household. Of the family households, 75.9 percent (54.5 million families) included a married couple, nearly half of whom were living with one or more children. About 7.6 million families, or 10.5 percent of all family households, consisted of a female living with her own children but no husband. Nonfamily households constituted 31.9 percent of all households. Individuals who lived alone accounted for 27.3 million, or 80.9 percent, of the nonfamily households.
Home ownership increased from 64.2 percent in 1990 to 66.2 percent in 2000. The number of owner-occupied units was 69.8 million, nearly double the number of renter-occupied units, 35.7 million. Another 10.4 million housing units were vacant at the time of the census.
Race and Hispanic ethnicity.
In 1997, the Office of Management and Budget (OMB) issued new guidelines on the core racial categories to be used in the census and other government projects. The revised guidelines required that at least five categories of race be distinguished: “White”; “Black or African American”; “American Indian and Alaska Native”; “Asian”; and “Native Hawaiian and Other Pacific Islander.” The 2000 census added the option to choose “Some other race.” People who identified themselves as American Indian were requested to specify tribal affiliation. People who checked “Some other race” were asked to write in their specific race.
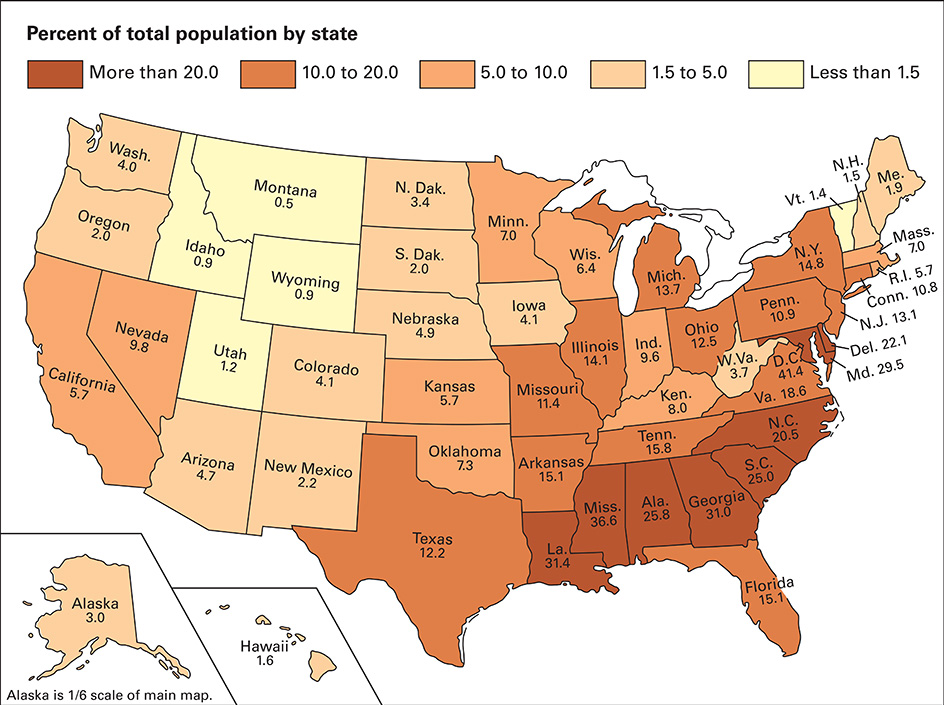
The 2000 census treated race and Hispanic ethnicity as separate. People of Hispanic heritage could select any race, and people of any race could indicate either Hispanic or non-Hispanic ethnicity.
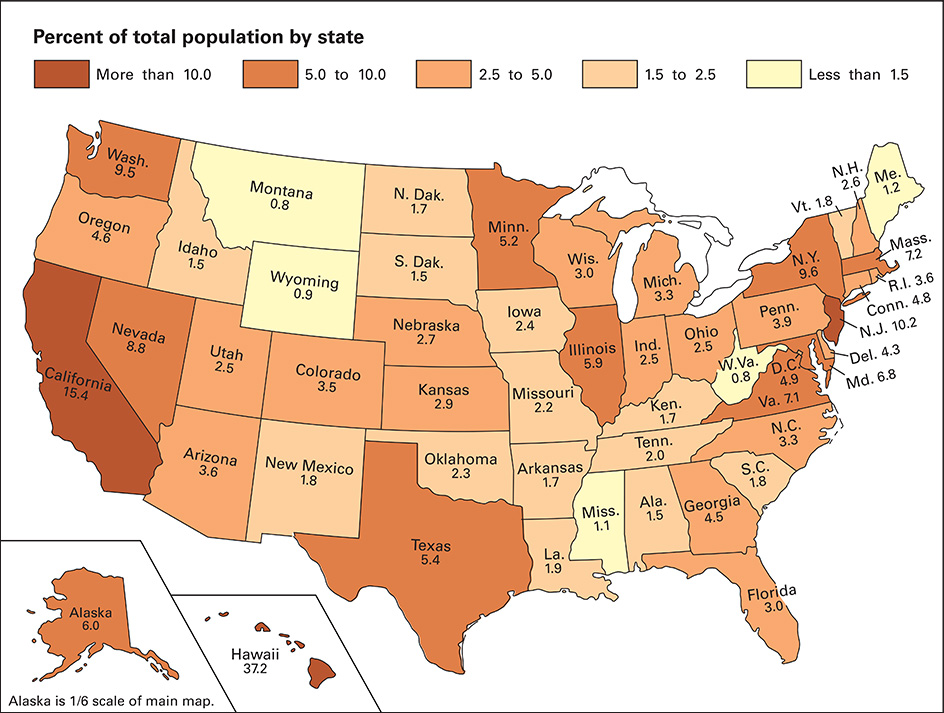
The largest racial group in 2000 was the white population. It numbered 211.5 million (75.1 percent of the total U.S. population). The black population totaled 34.7 million (12.3 percent). The Asian population was 10.2 million (3.6 percent). The American Indian and Alaska Native population was 2.5 million (0.9 percent). The population of Native Hawaiian and other Pacific Islanders was 0.4 million (0.1 percent). The 2000 census reported 15.4 million people (5.5 percent) belonging to an unspecified other race; nearly all of these people indicated Hispanic ethnicity on the separate ethnicity question. The census found that 6.8 million people (2.4 percent) identified themselves as belonging to more than one race.
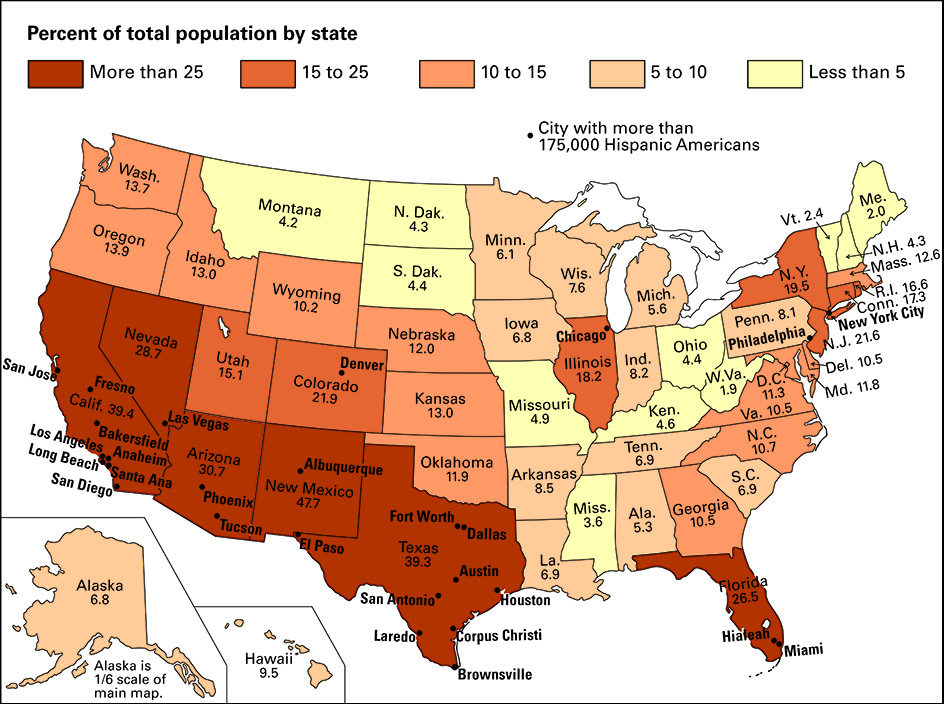
The number of people who reported Hispanic ethnicity was 35.3 million (12.5 percent of the total U.S. population). Mexicans (20.6 million) were the largest Hispanic group, followed by Puerto Ricans (3.4 million) and Cubans (1.2 million). Of the Hispanic respondents who reported a specific race, 93.0 percent were white, 3.9 percent were black, and 2.2 percent were American Indian.
Of the American Indians who reported their tribal affiliation in 2000, 281,069 said that they were Cherokee. The Navajo were the second largest tribe, with 269,202 members. The Sioux (108,272) ranked third.
Issues surrounding the census of 2000
Due to the complexity and importance of the census, people have often disagreed about the best ways to obtain and use population information. Some of the most important issues surrounding the census of 2000 involved the evaluation of error, the use of sampling and statistical adjustment, reapportionment and redistricting, and the categorization of race and ethnicity.
Evaluation and estimation of error.
A census has many opportunities for error. Recognition of the inevitability of census error has spurred sophisticated attempts to estimate the amount of error and to determine the causes. Two primary methods of estimating census error are demographic analysis and coverage measurement surveying.
Demographic analysis
relies on the idea that population totals in a given census should be consistent with numbers from previous censuses and data systems. For instance, the number of people aged 60 to 69 in 2000 should equal the number of people aged 10 to 19 from the 1950 census, minus the number who died or left the country, plus the number who immigrated. Population experts known as demographers use complex mathematical models to integrate information from successive censuses, along with information on births, deaths, and immigration and emigration. Demographic analyses, performed by independent scholars as well as by Census Bureau staff, have produced estimates of net undercounts—or, for some categories, net overcounts—for each decennial census.
Coverage measurement surveying
involves conducting a survey for a large sample of the population, along with or soon after the census. The results of this survey are then compared with the regular census information for the same people. The Accuracy and Coverage Evaluation (ACE) survey was a core part of the 2000 census operation. About 300,000 households served as the sample population to represent all the regions of the country.
In 2001, the Census Bureau announced that adjustments to the overall census count would not improve its accuracy. The bureau said that it could not reconcile the ACE results with the results from demographic analysis, and that all census data products would be based on the original count. These decisions were controversial, especially for some cities that believed their populations had been undercounted.
Sampling and statistical adjustment.
Early planning for the 2000 census proposed using sampling to reduce the cost of the census and to improve the quality of nonresponse follow-up. According to the plan, the bureau would determine the initial mail-back response rate for every sub-area of a few thousand people. If a sub-area’s response rate was very low, the bureau would use traditional follow-up procedures until the enumeration rate was at least 75 percent. Then, using the address list for the sub-area, it would select a carefully designed sample of one-tenth to one-third of the remaining nonrespondents. The bureau would then use statistical methods to estimate the numbers and characteristics of people living in the households that had not responded.
Studies by the National Academy of Sciences indicated that sampling for nonresponse follow-up was likely to improve the quality of the census and to reduce costs. However, opponents of the plan argued that sampling during nonresponse follow-up violated language in the U.S. Constitution calling for “an actual enumeration of the population.” In 1999, the Supreme Court of the United States, in a 5-4 decision, ruled that the law did not permit the statistical adjustment of figures used for the reapportionment (revised distribution) of congressional seats. The ruling did not apply to census data used for other purposes.
Detroit, New York City, and other cities sued the federal government in an effort to compel the use of statistically adjusted census totals. They argued that the census has a known undercount that is greater for minority groups and large cities than for other portions of the population. Failure to correct the census results for known errors, they argued, was therefore a violation of their constitutional rights to equal representation and fair distribution of federal funds. Opponents of the lawsuits favored conducting the census without government adjustment. The lawsuits were unsuccessful.
In early 2001, Census Bureau statisticians used the ACE survey to develop statistically adjusted census data. However, Secretary of Commerce Donald L. Evans decided at the time not to release the adjusted numbers for public use. Many groups challenged this decision. In 2002, a federal court required the Census Bureau to release the adjusted information. However, the impact of the decision was limited because most states had already used the original figures for reapportionment and redistricting.
Reapportionment and redistricting.
For reapportionment of Congress, each state’s population count included the totals of U.S. government personnel (both military and civilian) living overseas, as well as their dependents. The apportionment counts for states were then entered into a formula that determined how many seats in the House of Representatives each state would have.
Congress ordered the inclusion of overseas government personnel and their dependents for apportionment purposes. However, it did not order that other U.S. citizens in long overseas stays be counted. As a result, people who were living abroad as students or retirees or who were on temporary employment overseas were not counted. Many people argued that this procedure was unfair.
As a result of the 2000 census counts, 32 states kept the same number of seats in the House of Representatives as they had before. The remaining 18 states either gained or lost seats. Arizona, Florida, Georgia, and Texas each gained two seats. California, Colorado, Nevada, and North Carolina gained one. Connecticut, Illinois, Indiana, Michigan, Mississippi, Ohio, Oklahoma, and Wisconsin lost one. New York and Pennsylvania lost two.
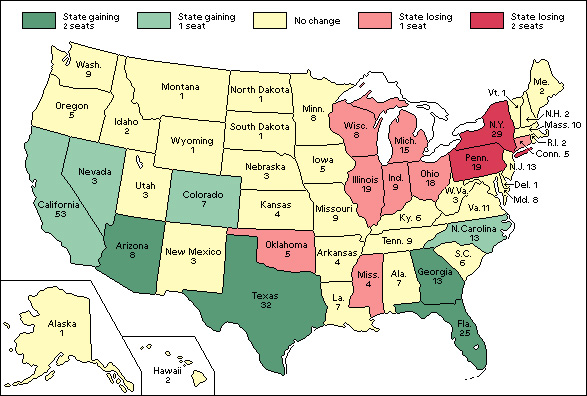
Redistricting refers to the drawing of new boundaries to define electoral districts. Each congressional district was required to be redrawn before the 2002 elections so that it was of the same population size as other districts within the state, using counts from the 2000 census. Census information also determined redistricting for thousands of election districts for state senates, state assemblies, city councils, and other government bodies.
Redistricting is a highly charged political process. It provides an opportunity for those in power to draw boundaries that include or exclude city blocks and neighborhoods that are expected to vote one way or another.
Race and ethnicity.
The census regularly revises its questions on race, due to changes in national policies, the data needs of government, and the ways people refer to themselves and others. The distinction between national origin and race has also changed through the years.
The instructions for the race question on the 2000 census form asked respondents to “mark one or more races to indicate what this person considers himself/herself to be.” In prior censuses, a person could select only one racial category. But during the 1990’s, many groups lobbied the Census Bureau, the Office of Management and Budget (OMB), and Congress for recognition of a multiracial category. As a result, the 1997 OMB guidelines required all federal agencies to allow respondents to select more than one race.
A separate question on the 2000 census forms asked whether a person was of Hispanic ethnicity, and if so, to indicate a more specific identity, such as Mexican or Dominican. The question on Hispanic ethnicity was presented separately from the race questions because the government considered race and Hispanic origin to be distinct. Responses to the race question, however, indicated that many people did not share the government’s distinction between race and Hispanic origin. Of the more than 15 million people who selected “Some other race,” nearly all were of Hispanic origin. This response indicates that many Hispanics regarded their Hispanic identity as primary and did not identify with any of the government’s core racial categories. Confusion involving the race and ethnicity questions may have resulted in undercounting for many Hispanic groups.
See also Census ; Census Bureau, United States ; Demography .
