United States census of 2010 was an extensive nationwide information-gathering project conducted by the U.S. federal government. The Census Bureau carries out a census of population and housing every 10 years. The bureau is an agency of the U.S. Department of Commerce. Census taking, also called enumeration, enables the government to obtain a current description of the people of the United States. This description includes the size of the population, as well as such facts as age, ethnicity, race, and sex. Because of its 10-year cycle, the U.S. census is called a decennial census. The 2010 census was the 23rd U.S. decennial census. The first one took place in 1790.
Census information helps government agencies administer programs, distribute funds, and study social and economic problems. Statistics provided by the census affect the distribution of government money for economic development, housing, school aid, welfare, and Social Security. In addition, population size determines the number of representatives each state will have in the U.S. House of Representatives. Lawmakers also use population totals to draw boundaries for electoral districts.
Planning, conducting, and processing a census is a difficult and expensive project. The census of 2010 employed over a million people and cost about $15 billion.
Conducting the 2010 census
Early planning for the 2010 census began while the 2000 census was still underway. During the 2000 census, the Census Bureau gathered ideas for how to improve the process.
Assembling a work force.
In preparation for the 2010 census, the Census Bureau established 12 regional census centers and 494 local census offices. Many permanent Census Bureau employees were assigned to key positions in these field offices. A major task for the field offices was to recruit and train hundreds of thousands of temporary employees.
The Census Bureau conducted two “dress rehearsal” censuses in 2008. These rehearsals were held in San Joaquin County, California, and in the Fayetteville, North Carolina, area. The bureau used these rehearsals to test procedures and to identify and correct problems.
Questionnaire.
For all censuses from 1960 to 2010, the Census Bureau mailed out lists of questions and asked the public to complete them and mail them back. In 2010, the Census Bureau used a single list of questions called the short-form questionnaire. This questionnaire asks a small number of basic questions. It asks the same questions of all households. Items on the questionnaire include the names of people in the household, their ages, and their race or Hispanic ethnicity. The questionnaire also asks whether the housing unit is owned or rented.
From 1940 to 2000, the Census Bureau had also used a long-form questionnaire. This questionnaire included additional social, economic, and housing questions. These questions were asked of only a sample of all households. In 2005, the bureau replaced the long-form questionnaire with the American Community Survey (ACS). The ACS is a permanent sample survey that collects certain data annually. One advantage of the American Community Survey is timeliness. A continuously running survey produces more current results than a census taken every 10 years.
Some Americans argue that the Constitution of the United States calls only for a head count. They claim that other questions are an invasion of privacy. However, many courts have ruled that it is constitutional to collect various statistics in the census.
Distributing forms.
A key resource for conducting a census is the master address file, a listing of about 145 million addresses. An accurate address list makes it possible to reach a high percentage of households with the first mailing of questionnaires. Reaching households by means of mailed questionnaires reduces the cost of having individual enumerators (census takers) find residences and ask questions in person.
The Census Bureau mailed out advance letters in early March 2010 and questionnaires in mid-March. Recipients were asked to make all answers accurate as of Census Day, April 1, 2010.
The Census Bureau made arrangements to reach people who do not live in individual houses or apartments. The census identifies these people as living in group quarters. Examples of group quarters include college dormitories and prisons. Instead of mailing the questionnaire, the Census Bureau visited the locations and distributed the forms. Census workers then collected the completed forms. Another special program was designed for counting homeless people. The bureau counted people staying at shelters and other sites where homeless people are known to spend the night.
Prompting response.
An extensive publicity campaign encouraged response to the census. The Census Bureau established partnerships with local governments, schools, community organizations, and other institutions to distribute information about the census. In addition, the bureau, with congressional approval, used paid advertising to encourage response. The bureau spent more than $130 million on television, radio, and print advertisements. The Census Bureau also offered assistance by telephone, over the Internet, and at 30,000 questionnaire assistance centers.
Collecting forms.
Most households that received census questionnaires mailed them back within a few weeks. The questionnaire return rate for the 2010 census was 74 percent, the same rate as in 2000. Although the response rate was high, it still left about one-fourth of the questionnaires unreturned.
The bureau’s nonresponse follow-up program obtained the missing information. From May through July, enumerators visited the addresses for which no questionnaire had been returned. If an adult member of a household was located, the enumerator asked him or her to answer the questions for each member of the household. In some cases, enumerators returned to an address several times in an effort to find someone at home.
Releasing information.
After processing the data it collected, the Census Bureau delivered population counts to the president of the United States on Dec. 21, 2010. Official counts for counties, cities, townships, and all other political jurisdictions appeared in February 2011. The bureau also released data for millions of geographic areas, such as city blocks and their equivalents in rural areas. The Census Bureau released further information as processing was completed. More information about the 2010 census is available at http://www.census.gov.
An overview of census results
The official count of the population of the United States on April 1, 2010, was 308,745,538. This marked an increase of 9.7 percent over the 2000 census count of 281,421,906. The population growth rate was the lowest census-to-census increase since the Great Depression.
Population distribution.
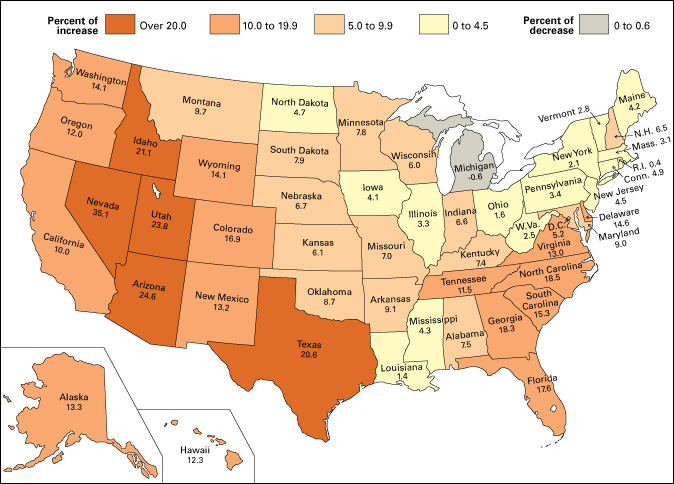
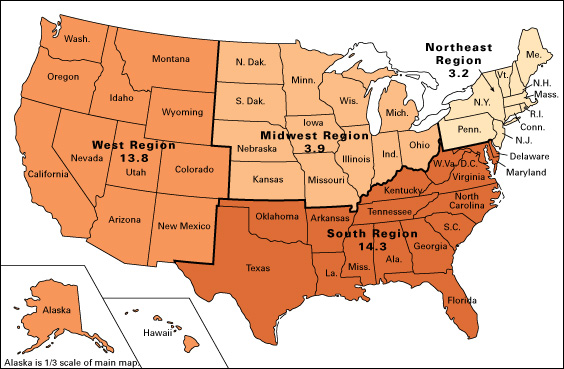
Every state except Michigan gained population during the first decade of the 2000’s. However, some regions showed more growth than others. The South as a whole grew 14.3 percent, the West 13.8 percent, the Midwest 3.9 percent, and the Northeast 3.2 percent. Of the 20 states with the highest population growth rates, 19 were in the West and the South. In total numbers, the South remained the most populated region, with 114.6 million people. It was followed by the West with 71.9 million, the Midwest with 66.9 million, and the Northeast with 55.3 million.
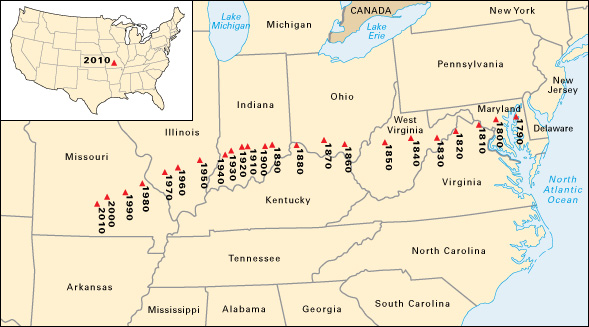
The fastest rates of growth occurred in the states of Nevada (35.1 percent), Arizona (24.6 percent), and Utah (23.8 percent). The largest numerical increases were in Texas (4.3 million), California (3.4 million), and Florida (2.8 million). Nearly 40 percent of the total U.S. population growth from 2000 to 2010 occurred in just these three states. Three other states, Arizona, Georgia, and North Carolina, each increased by at least 1 million people.
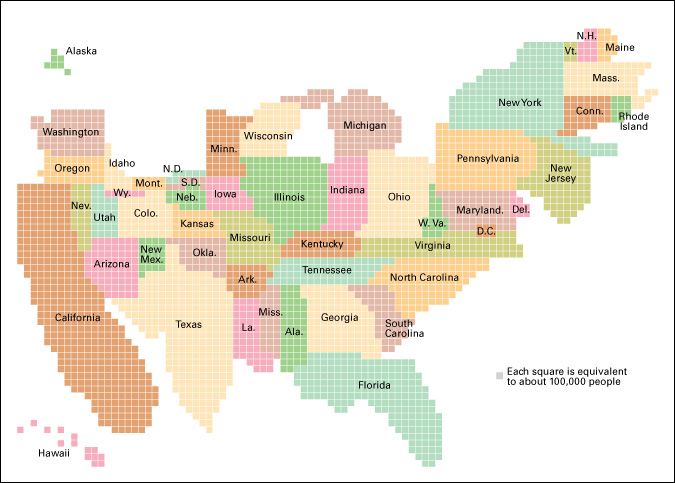
Many large cities had population increases during the first decade of the 2000’s. For example, New York City, the nation’s largest city, gained about 167,000 people, for a total of 8,175,133. San Antonio was the fastest-growing of the 10 largest cities. Its population grew by 16 percent, from 1,144,646 people in 2000 to 1,327,407 people in 2010. Of the 10 largest cities, Chicago was the only city to lose population. Its population fell by about 7 percent, from 2,896,016 people in 2000 to 2,695,598 people in 2010. Many industrial cities lost population between 2000 and 2010, including Cleveland, Detroit, Pittsburgh, and St. Louis. Partially because of the devastation caused by Hurricane Katrina in 2005, New Orleans lost nearly 30 percent of its population, the biggest percentage drop among U.S. cities.
Most large central cities continued to lose white population. Growing suburban areas, however, gained large numbers of Hispanic, Asian, and African American residents in addition to the traditional white population.
Age, sex, families, and housing.
In 2010, the median age of the U.S. population was 37.2 years. This means that half the people were younger than 37.2, and half were older. This median age was the oldest ever, and a jump of 1.9 years since 2000. This increase in age was partially the result of improvements in health and medicine that enabled more people to live longer lives. The increase also reflected a decline in the number of children per family. The aging of the baby boom generation—the large group of people born in the United States from 1946 to 1964—was another factor that contributed to the increase in the median age. In 2010, baby boomers aged 55 to 64 represented the fastest-growing age group.
Of the total population, there were 151.8 million males (49.2 percent) and 157 million females (50.8 percent). In the age group under 20, boys outnumbered girls 42.6 million to 40.7 million. At ages 65 and over, women outnumbered men 22.9 million to 17.4 million.
In 2010, there were 116.7 million households, 66.4 percent of which were families. For census purposes, a family is defined as a set of two or more people who are related by birth or marriage and who live in the same household. Of the family households, 72.9 percent (56.5 million families) included a married couple. About 8.4 million families, or 7.2 percent of all family households, consisted of a female living with her own children but no husband. Nonfamily households made up 33.6 percent of all households. Individuals who lived alone accounted for 31.2 million, or 79.6 percent, of the nonfamily households. The make-up of families is changing. The 2010 census was the first census in which married couples represented less than half of all households. However, the number of unmarried couples living together increased from about 5 1/2 million couples in 2000 to about 7 3/4 million in 2010.
Home ownership decreased from 66.2 percent in 2000 to 65.1 percent in 2010. This decline was the largest decrease since the Great Depression. The number of owner-occupied units was 76 million, nearly double the number of renter-occupied units, 40.7 million. Another 15 million housing units were vacant at the time of the census. Between 2000 and 2010, the number of vacant housing units increased nearly 45 percent.
Race and Hispanic ethnicity.
The largest racial group in 2010 was the white population. It numbered 223.6 million (74.6 percent of the total U.S. population). The Black population totaled 38.9 million (13.0 percent). The Asian population was 14.7 million (4.9 percent). The American Indian and Alaska Native population was 2.9 million (1.0 percent). The population of Native Hawaiian and other Pacific Islanders was 0.5 million (0.2 percent). The 2010 census reported 19.1 million people (6.4 percent) belonging to an unspecified other race. Nearly all of these people indicated Hispanic ethnicity on the separate ethnicity question. The census found that 9 million people (2.9 percent) identified themselves as belonging to more than one race.
The number of people who reported Hispanic ethnicity was 50.5 million (16.3 percent of the total U.S. population). Mexicans (31.8 million) were the largest Hispanic group, followed by Puerto Ricans (4.6 million) and Cubans (1.8 million). The 2010 census marked the first census in which Hispanics were the largest minority. Hispanics accounted for about 55 percent of America’s total growth between 2000 and 2010. Nearly half of all Hispanics lived in California or Texas. Many other Western states also had a large Hispanic population.
The 2010 census was the first in which Black people ranked as the second largest minority. African Americans had long ranked as the country’s largest minority. In the 2010 census, about 39 million people identified themselves as being Black alone. Another 3 million people reported that they were Black in combination with one or more other races. Black people made-up slightly over half the population of Washington, D.C. They accounted for over a quarter of the population of Alabama, Georgia, Louisiana, Maryland, Mississippi, and South Carolina.
Reapportionment and redistricting.
For reapportionment of Congress, each state’s population count included the totals of U.S. government personnel (both military and civilian) living overseas, as well as their dependents. The apportionment counts for states were then entered into a formula that determined how many seats in the House of Representatives each state would have.
Congress ordered the inclusion of overseas government personnel and their dependents for apportionment purposes. However, it did not order that other U.S. citizens on long overseas stays be counted. As a result, people who were living abroad as students or retirees or who were on temporary employment overseas were not counted. Many people argued that this procedure was unfair.
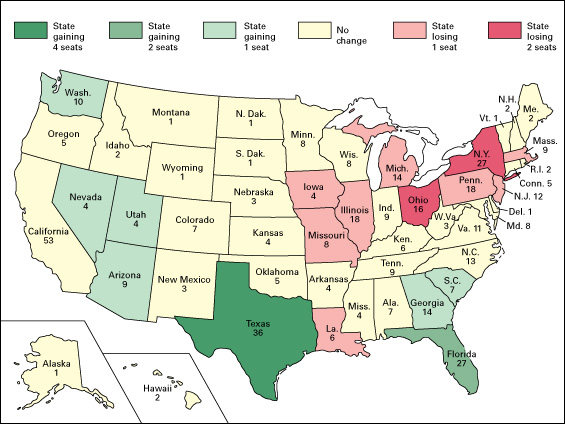
As a result of the 2010 census counts, 32 states kept the same number of seats in the House of Representatives as they had before. The remaining 18 states either gained or lost seats. Texas gained four seats, and Florida gained two. Arizona, Georgia, Nevada, South Carolina, Utah, and Washington each gained one. Illinois, Iowa, Louisiana, Massachusetts, Michigan, Missouri, New Jersey, and Pennsylvania lost one. New York and Ohio lost two.
Redistricting refers to the drawing of new boundaries to define electoral districts. Each congressional district was required to be redrawn before the 2012 elections so that it was of the same population size as other districts within the state, using counts from the 2010 census. Census information also determined redistricting for thousands of election districts for state senates, state assemblies, city councils, and other government bodies.
Redistricting is a controversial political process. It provides an opportunity for those in power to draw boundaries that include or exclude city blocks and neighborhoods that are expected to vote one way or another.
