Graph is a drawing that shows the relative sizes of numerical quantities. It is used to present facts in picture form so that they will be clearer and easier to understand.
Line graphs
are the simplest type of graph. They are also one of the easiest ways to compare numbers.
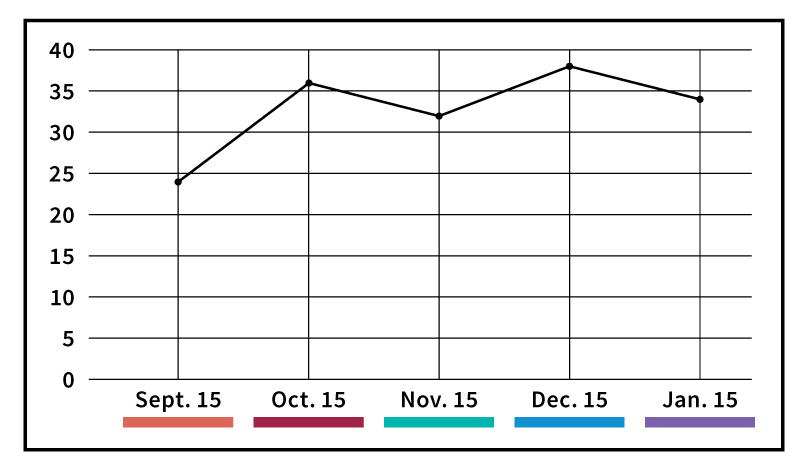
Line graphs are made using a grid. The vertical axis (scale) indicates frequency, and the horizontal axis shows the categories being considered. For example, the frequency could be the number of pupils present, and the categories could be dates. Points on such a graph would indicate how many pupils were present on each date.
Line graphs can be used to present many kinds of data, such as the grades a pupil achieves on certain days, or the production level of factories or farms at a given time. They can illustrate statistics of income, taxes, and wealth, as well as athletics, trade, and population.
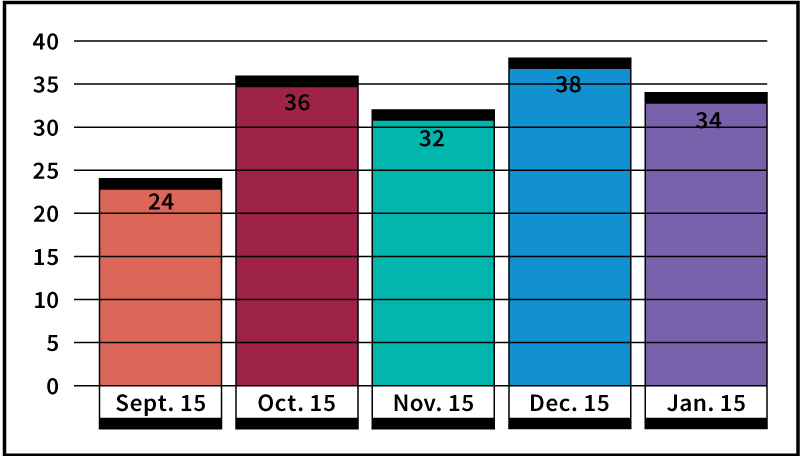
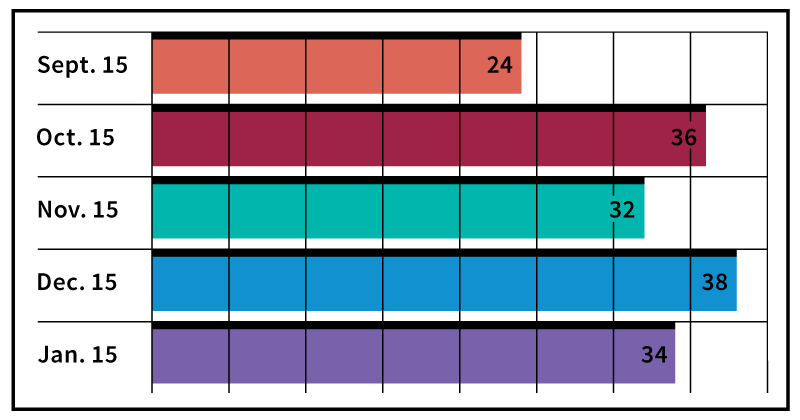
Bar graphs
are a good way to compare increases and decreases in quantity over a period of time. There are two kinds of bar graphs—horizontal bar graphs and vertical bar graphs.
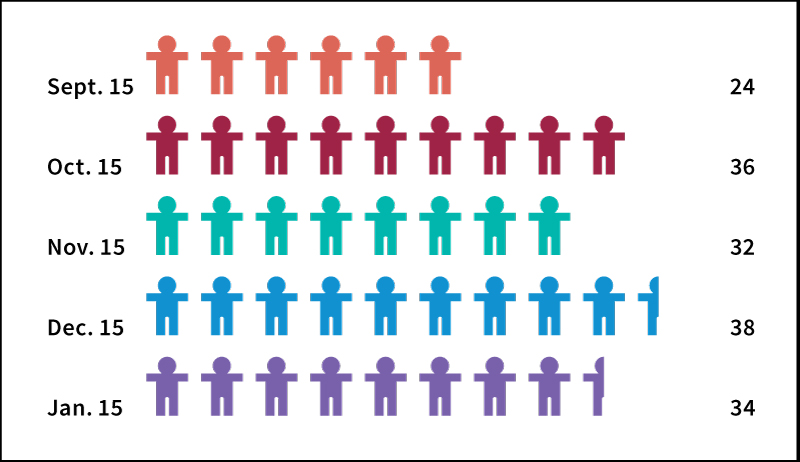
Picture graphs
convey information through symbols instead of lines or bars. The pictorial form of these graphs helps readers understand the meaning of data without having to examine lists of figures. Picture graphs are most often used in magazines and newspapers. This type of graph originated in the pictographs used by primitive people and was the earliest form of writing.
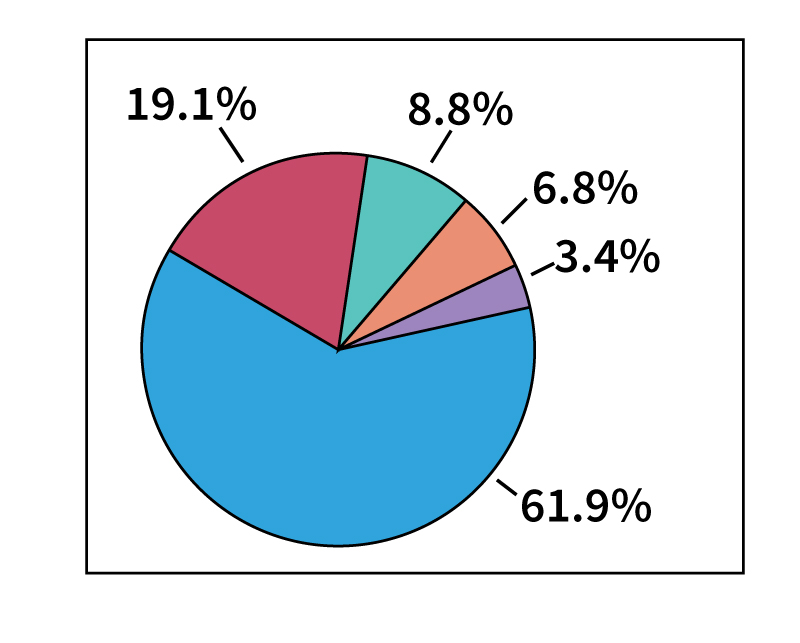
Circle graphs
show the relation of parts to the whole. For example, suppose the cost of education in a country was $2 billion and this sum was divided as follows: general control, 3.4 percent; instruction, 61.9 percent; operation, maintenance, and auxiliary agencies, 19.1 percent; capital outlay, 8.8 percent; interest, 6.8 percent. If a circle graph is constructed, these percentages appear as wedges that look like pieces of pie. For this reason, such graphs are often called pie charts.
Graphs can be used to illustrate many types of data and are not limited to the simpler types discussed here. They should be used to make facts clearer and more understandable.